Investigating Musical Affect
In Spring 2018, I led a class which put the basic hypothesis of the Sound-Energy Aggregate theory to the test. One may still participate in the study (though the data will contribute to a second analysis since I’ve already collected the data from the first two months the experiment has run) by following this link. I have promised participants and others an account of the experiment, which I will provide here.
Abstract
The question of emotion in music has been a point of contention for more than four centuries. Much research centers on the question today, but the focus is virtually always on pitch, melody, and so forth. While these are clearly important factors in the creation of musical energy, it is likewise clear that other factors influence or perhaps even largely determine the impact music has on a listener. A broad survey of research into music cognition reveals that certain factors not actually studied in experiments nonetheless turn up to be mentioned as primary determinants of musical energy (emotion, impact), — things like dynamics, articulation, the obvious stuff. While not the impetus for the current experiment, which is in fact a longer story, these references add validity to the aims of the current study.
The study seeks to document the impact on musical energy of changes in single parameters at a time in order to prove the larger hypothesis, that the interaction of energies created by each parameter generates the composite outcome, the Sound-Energy Aggregate. By stating a short musical idea in a moderate range, with moderate dynamic, moderate articulation, and moderate tempo, and gauging the affect (musical energy, impact), then comparing the perceived affect after changing one of the parameters to an extreme (dynamic, articulation, tempo, register), we seek to establish the first-level influence of a single parameter change. By then comparing perceived affect when changing another parameter to an extreme state, we will determine whether a statistically significant number of respondents agree on the musical energy that results. The first-level impact is pretty widely accepted, and it seems obvious that a second-level impact will be established as well. We await adequate statistical analysis of the data collected in order to make further claims.
Experiment design
A short melodic fragment is played on clarinet in every musical example. Participants rate the affect they perceive to be in the music using a list of words devised by the class to cover all potential energies. We referred to existing lists, specifically the Geneva Emotional Music Scales and the Hevner Mood Clock, using neither but ensuring that we had covered the same energies.
The first example heard by most participants, what might be thought of as the reference example, is neutral: it is in a middle register, with moderate volume, innocuous articulation, and moves at a moderate speed. We recorded a series of altered versions, ensuring that a change in each parameter is heard while other parameters remain neutral. Only in the (neutral) middle register do other neutral parameters exist, and all combinations of extreme parameters are included. A spreadsheet showing all combinations might help one conceive all this:
(((. )))
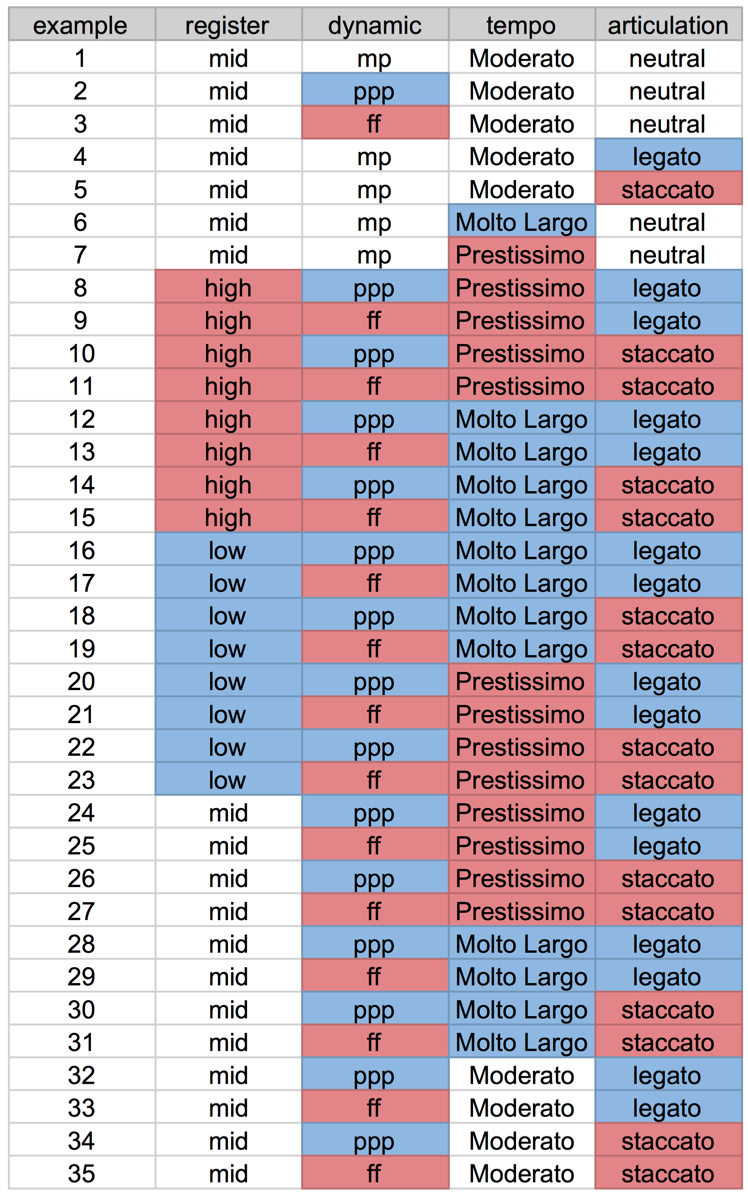
blank (white) = neutral, red and blue are extremes * columns are parameter values, rows are examples
An essential problem to overcome in testing responses is the sheer number of examples (35) one would need to experience in order to gauge the energy of each. Knowing that participants would tire, and probably not complete the examples, we proceeded to randomize the encounters. We used Google Forms to carry our examples and solicit responses, and it is impossible to move from one form to another and keep track of a participant’s record of responses. We therefore decided that we would create enough forms to ensure that no participant had to evaluate more than five musical examples, and randomize where participants started. For reasons to be explained below, we ended up needing 20 forms which carried two complete sets of the examples.
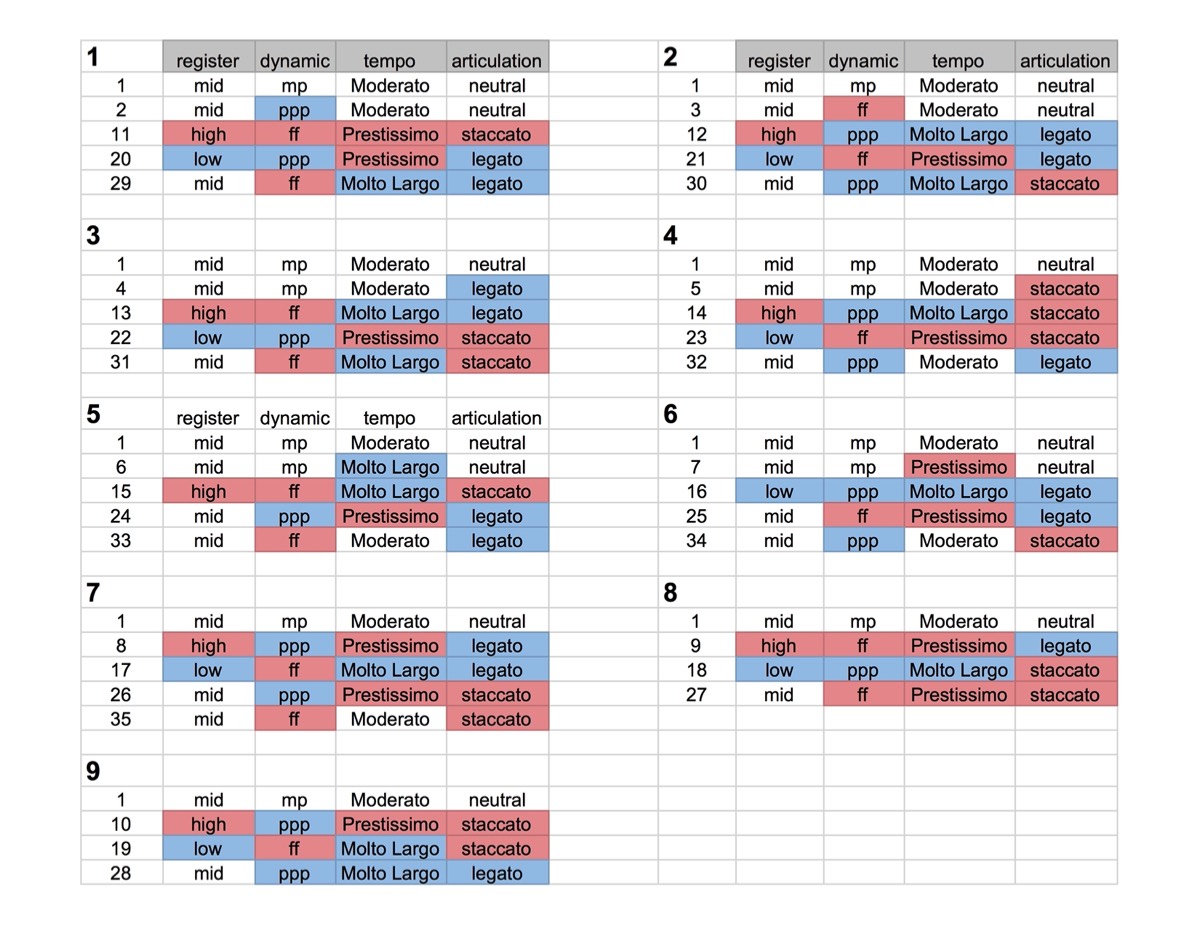
blank (white) = neutral, red and blue are extremes * columns are parameter values, rows are examples * large numerals refer to Google Form container
One set of examples (shown in the spreadsheet above) takes a person through a randomized series of combinations, while a second one (provided below) ensures that only one parameter changes at a time. That sequence had to be longer to accommodate all examples. This aspect of the design will allow us to check responses to a given example and determine to what degree the energy evaluation is influenced by the order of presentation, or whether it stands regardless of order of encounter.
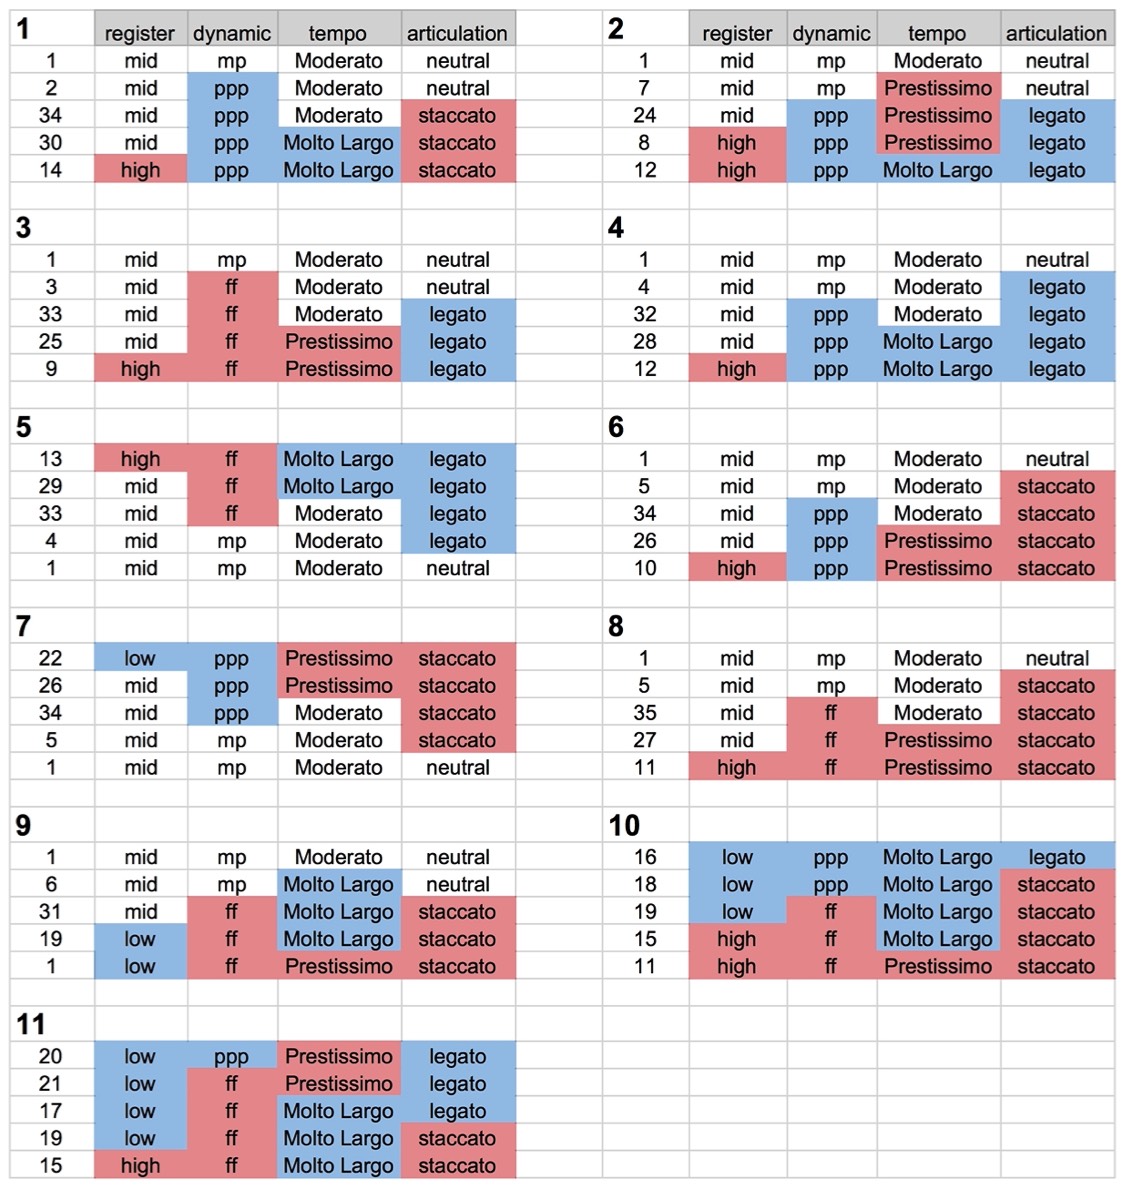
blank = neutral, red and blue are extremes * columns are parameter values, rows are examples * large numerals refer to Google Form container